Widgetized Section
Go to Admin » Appearance » Widgets » and move Gabfire Widget: Social into that MastheadOverlay zone

A Getting Well Card for Survey Research
The views expressed are those of the author and do not necessarily reflect the views of ASPA as an organization.A Getting Well Card for Survey Research
By Thomas Miller
October 3, 2017
It has been a hard run for survey research what with the underestimate of Trump support in key Midwestern states and misses for Brexit. With these misses comes a growing uncertainty that polls can continue to be relied on to “get it right.” Will poll results become just the next example of fake news because, really, nothing can be trusted?
Elsewhere I’ve described how polling is not the same as surveying. “While surveys and polls are in the same class—like mammals—they are by no means the same species – e.g. dolphins vs. foxes.” Although pollsters have to be slyer than us pretty smart survey researchers, it’s the polls that not only predict the behavior of the electorate but those predictions are trotted onto media red carpets where the beauty of prognostication is to be ogled. Unfortunately predictions of voter behavior are as subject to mistakes as are wardrobe malfunctions.
Since there are few instances where survey respondent opinions can be tested against real world outcomes (like election results), it’s the political polls that our survey work relies on to bolster our credibility. Now that polls are starting a comeback with France’s recent election, this seems a good time to reinforce the validity of quality survey research, at least of the kind done by the organization I represent and others like it, in cities and counties across the U.S.
The surveys many local governments sponsor are called “citizen surveys” and they typically include questions asked of a representative sample of residents about the quality of community life, service delivery, public trust and resident engagement. First, it is important to acknowledge that there is little hard data which can ‘prove’ the accuracy of residents rating the quality of life to be “excellent.” Neither is it easy to show that residents who say their city is ‘moving in the right direction’ act in ways that demonstrate the precision of the sentiment.
Often we acknowledge that trash pickup could occur three times a week but quality ratings still could be low. Such a warning about trash collection ratings not only alerts our clients that public opinion is valuable in its own right even if it fails to confirm “known” circumstances, but the warning serves as well to exonerate the survey results from having to conform to secondary data (such as the frequency of trash collection or the number of complaints about it) whose connection could prove—or disprove—the survey’s validity.
So when there are solid administrative data to compare to respondent sentiment, it is worth noting what comparison of the two data sources shows. When we point to a close relationship between citizen perspectives and something measured in the environment that could influence those perspectives, we have a case, not unlike election results, that bolsters the validity of surveys.
Some years ago, a colleague and I published a study showing a strong relationship between the optimism respondents had about their family’s economic future and the unemployment rate in the country. Our survey results about personal economic optimism came from a non-random selection of a large number of jurisdictions whose residents completed surveys about their life and their community. When the unemployment rate decreased, optimism about the future improved and vice versa, suggesting that the survey, in fact, measured residents’ accurate view of their real economic potential.
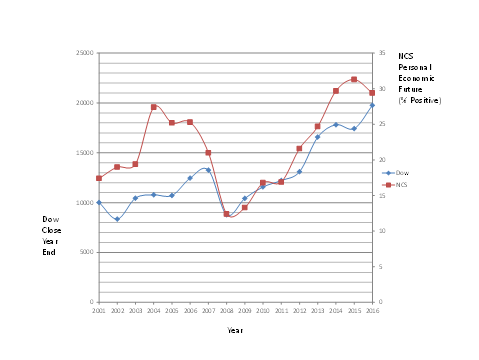
To test the linkage again, we completed an analysis of averaged annual ratings on the same question correlated, this time, with the year-end closing value of the Dow Jones Industrial Average (DJIA). The survey question reads as follows (taken from The National Citizen Survey™ : “What impact, if any, do you think the economy will have on your family income in the next 6 months? Do you think the impact will be: very positive, somewhat positive, neutral, somewhat negative, or very negative?” We correlated the average percent of respondents who said very or somewhat positive each year from 2001 to 2016. There were 489,058 respondents with no fewer than 20,000 in any given year taken from the surveys conducted by National Research Center (NRC) in hundreds of jurisdictions across the United States. Again, the jurisdictions self-selected by choosing to hire NRC, so they are not intended to represent a random sample of places or people.
Nevertheless, as in the previous study linking this same survey question with the U.S. unemployment rate, our current study showed a strong positive relationship (r=.74) between optimism and the DJIA. The graph below shows the results.
This is the kind of news survey research needs these days, and local governments, steering clear of politics altogether, are helping to make the case that surveys can be trusted to bring a valid sample of public opinion to hometown decisions.
Author: Thomas Miller is president of National Research Center, Inc. (www.n-r-c.com) (NRC) a data analytics and survey research firm that he founded in 1994 to bring the voice of employees and residents into local government decision-making. He can be reached at [email protected].
 (No Ratings Yet)
![]() Loading...
Loading...
Follow Us!