Widgetized Section
Go to Admin » Appearance » Widgets » and move Gabfire Widget: Social into that MastheadOverlay zone

English Language Learners and the Changing Face of Education
The views expressed are those of the author and do not necessarily reflect the views of ASPA as an organization.
By Grant E. Rissler
July 26, 2016
The changing face (and language) of public school students
In 1995, when I graduated from high school, a clear majority of public school students in the U.S. (64.8 percent) were white. When my 30th high school reunion rolls around in 2025, the National Center for Education Statistics (NCES) currently estimates that whites will make up 45.6 percent of the public school population (see Table 1).
Table 1: Changing Percentages of Public School Students by Race/Ethnicity
|
|
White |
Black |
Hispanic |
Asian |
|
1995 |
64.8 percent |
16.8 percent |
13.5 percent |
3.7 percent |
|
2015 |
49.3 percent |
15.6 percent |
25.9 percent |
5.3 percent |
|
2025 |
45.6 percent |
15.2 percent |
28.5 percent |
6.1 percent |
Strong flows of Hispanic and Asian immigrants drive a significant portion of the shift. The changing “face” of students is accompanied by a change in the language capacity the same students have when they first enter school.
In 2000, the number of English language learners (ELLs) was 3.4 million or about 6 percent of the student population. By the 2013-14 school year, ELL program participants reached 9.3 percent or almost 4.5 million.
The growing proportion of ELLs in public schools reshapes how schools need to interface with the community how teachers present content and what teachers schools seek to hire. Check out these two lists of best practices from Adolescent Literacy and Colorin Colorado!
What defines an English language learner?
While many ELLs are immigrants or the children of immigrants, the ELL designation is specifically for children aged 3-21 “whose difficulties speaking, reading, writing, or understanding the English language may be sufficient to deny the individual” an ability to meet state standards, to achieve in English classrooms and to participate fully in society. This definition can apply to children born in the U.S. who grew up in a non-English dominant household. Sometimes, ELLs are referred to as limited English proficient students (LEP) or English learners (EL).
Which states have the largest numbers and percentages of ELLs?
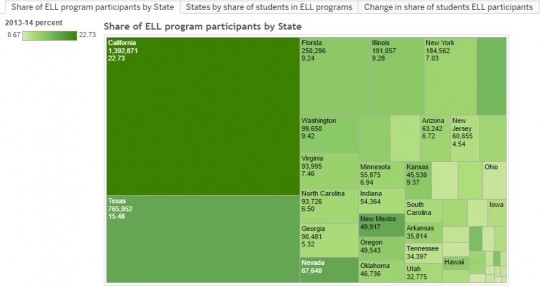
We can clearly see from the Tableau Public visualization below that California and Texas are the states with the greatest number of ELLs, with more than 2.1 million of the roughly 4.5 million total ELLs enrolled in U.S. schools. (To explore the data in detail, click here.)
Figure 1: Developed by Grant E. Rissler from 2013-14 NCES Digest of Education Statistics – Table 204.20
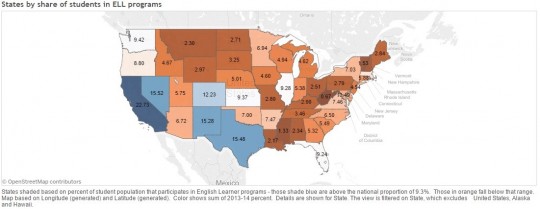
The second figure draws the contrast more clearly between states in terms of the share of the population that participates in ELL programs. Clearly, larger proportions are found in the Southwest and traditional gateway states of Illinois and Florida. Nearly 23 percent of public school students in California are ELLs. However, new immigrant destinations in Washington, Oregon, Nebraska, Minnesota and Virginia also have higher shares of ELLs.
Figure 2: Developed by Grant E. Rissler from 2013-14 NCES Digest of Education Statistics – Table 204.20
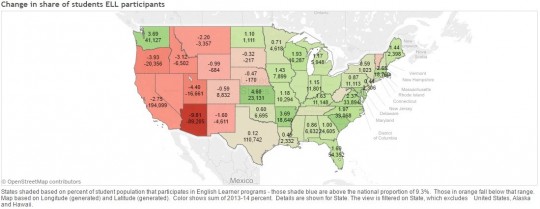
The shift over time in each state is shown in this final figure – based on the percentage point change over a decade in the share of public student population that participate in ELL programs. For example, from 2003- 2004 to 2013- 2014, the share of ELLs went from 25.5 percent in California to 22.7 percent, a decrease of about 2.8 percentage points. Clearly, some of the largest increases in the share of ELLs are in states not usually thought of as leading in diversity: Nebraska, Arkansas and South Carolina.
Figure 3: Developed by Grant E. Rissler from 2013-14 NCES Digest of Education Statistics – Table 204.20
What has been the impact of NCLB and what might be the impact of ESSA?
When the No Child Left Behind Act (NCLB) became law in 2002, some educators and researchers were optimistic that it would help improve educational opportunities for immigrant and ELL students because ELLs were one of the student sub-groups that schools were required to disaggregate from overall data and report on their progress explicitly. (For a detailed explanation, see Capps et. al.) ELLs were expected to meet the same standards as other students in math, science and social studies while also reaching English proficiency. It was thought that schools might pay more attention to ELLs and focus on them achieving these goals.
As time provided greater evidence like this 2011 report from the Migration Policy Institute (MPI), some drawbacks to NCLB’s focus on accountability through disaggregated test data became apparent. In 2012, Hamayan argued that high-stakes testing became the only measure that officials cared about, producing greater stress on ever younger cohorts and forcing every child into the same timing for reaching certain goals.
In December 2015, Congress finally passed an update to NCLB—the Every Student Succeeds Act (ESSA). Researchers like Delia Pompa at MPI have summarized some of the key changes, including more flexibility for states to determine certain standards. The new bill maintains accountability for how ELLs meet certain goals, gives them a higher profile in the legislation and mandates standard processes for classifying and exiting students from ELL special services.
However, the added flexibility for states means those advocating for ELLs will need to advocate in 50 different state governments about detailed choices. How this legislation impacts on the ground policy implementation by schools will continue to be a key area to watch, as well as an important part of the U.S. journey toward a more diverse population.
Author: Grant Rissler is a doctoral candidate in public policy and administration at the L. Douglas Wilder School of Government and Public Affairs, Virginia Commonwealth University (VCU). A former immigration paralegal, his current research focus is local government responsiveness to immigrants. He also serves as assistant director for programs for the Commonwealth Educational Policy Institute at VCU. Grant can be reached at [email protected].
 (No Ratings Yet)
![]() Loading...
Loading...
Pingback: Immigrants and the Elderly | PA TIMES Online