Widgetized Section
Go to Admin » Appearance » Widgets » and move Gabfire Widget: Social into that MastheadOverlay zone

Taking Stock of the American Labor Market
The views expressed are those of the author and do not necessarily reflect the views of ASPA as an organization.
By Thomas Young
April 8, 2024
Last Friday, the Bureau of Labor Statistics (BLS) released their monthly jobs report. As has been widely reported, the number of jobs created blew through expectations at 303,000 in March. This better-than-expected number begs the question: How healthy is the American labor market? Here are seven charts to address that question.
The Broad View
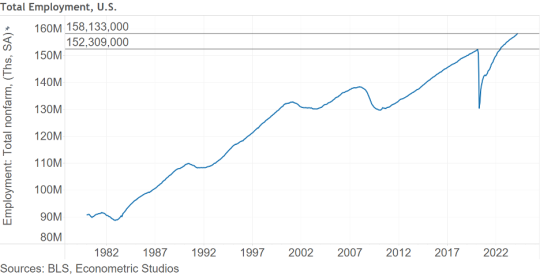
First, the broad picture. There are 158,133,000 employed individuals in the United States (seasonally adjusted, Employer Survey). This is up from the pre-pandemic February 2020 count of 152,309,000. Overall, although there are definitely issue with the American labor picture, it could be much, much worse.
Figure 1: Total U.S. Employment Count
The Labor Force Participation Rate
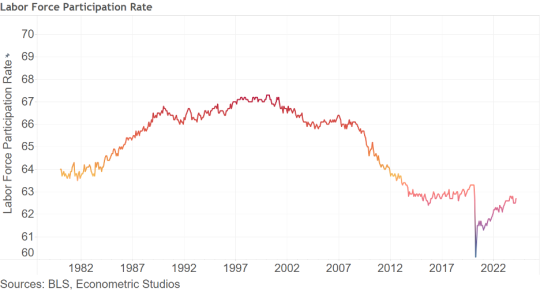
Another gauge of the American labor picture is labor force participation. At 62.7 percent, the working age population is still behind where labor force participation stood in February 2020 at 63.3 percent. On the one hand, this suggests there’s room for further employment expansion, while on the other hand it perhaps suggests that fewer Americans want to work the jobs that await them in the labor market, as measured by the relatively high underemployment rate.
Figure 2: Labor Force Participation Rate
The Full-Time and Part-Time Employment View
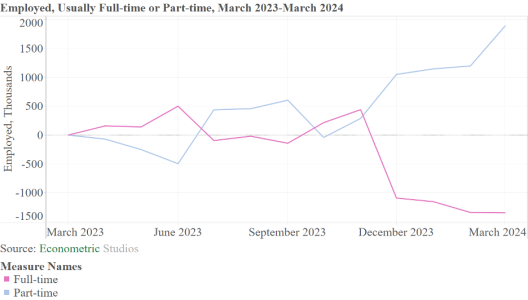
A third view of the American labor picture is the reporting of individuals saying they usually work full-time and those that report usually working part-time. According to the Household Survey (a survey by the BLS of a sample of U.S. households), since 2023, the number of individuals reporting that they usually work full-time is down 1.347 million. By contrast, the number of individuals reporting that they usually working part-time is up 1.888 million. The drop in full-time employment began in December 2023, at the same time that part-time work started rising quickly. That being said, this does not necessarily suggest that a downturn in economic conditions is imminent, but it does suggest we proceed with caution.
Figure 3: Full and Part-time Employment, March 2023 to March 2024
The Wage View
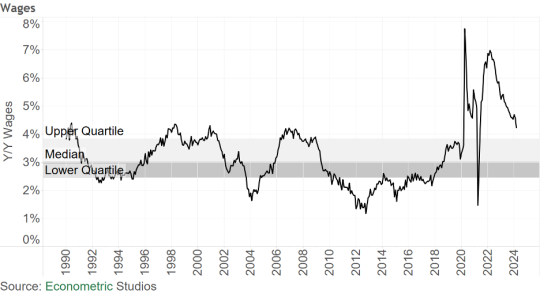
The fourth figure is a view of workers’ wages. Year-over-year growth in wages stood at 4 percent in March, down from the March 2022 peak of 7 percent. Although wages are trending down, wage growth of 4 percent is still well above what would be comfortable for Federal Reserve policymakers, whose job it is to bring inflation down to 2 percent (preferably 0). The wage picture suggests there’s still a long way to go to get inflation back to a level that’s most beneficial to long-term economic growth.
Figure 4: Year-over-year Wage Growth
The Unemployment Picture
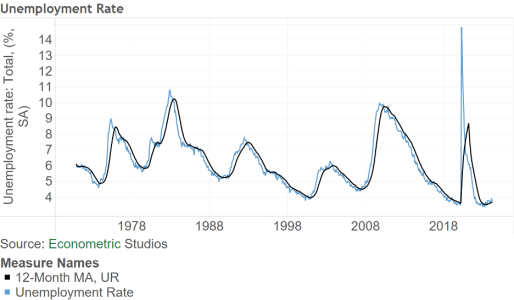
The fifth view is the unemployment picture. Shown in the figure below is the BLS’ reported unemployment rate with its 12-month moving average. Overall, the U.S. unemployment rate dropped from 3.9 percent in February, to 3.8 percent in March. Of slight concern, the unemployment rate has been floating above its 12-month moving average for almost a year now (since May 2023). Typically, when the actual unemployment rate floats above its 12-month moving average, the United States is either in a recession or is on the cusp of entering one. This measure is worth watching.
Figure 5: Unemployment Rate and Its 12-Month Moving Average
The Industry View
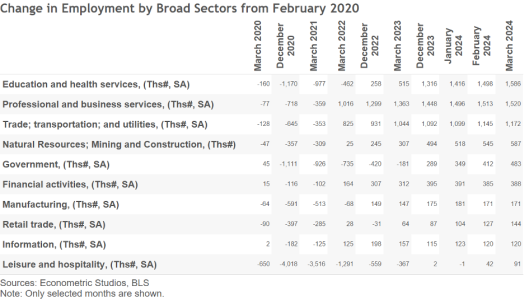
The sixth picture is by industry. Shown in the following figure is the change in employment by broad economic sectors from February 2020 to March 2024 (only select months are shown). The top gaining sector over the past four years has been Education and Health Services, adding a net 1.586 million jobs. The other members of the top three include Professional and Business Services with a net gain of 1.520 million and Trade, Transportation and Utilities with a net gain of 1.172 million.
On the bottom end of the picture, Leisure and Hospitality finally turned positive in 2024 and by March 2024 had 91,000 more employees than it did in February 2020. Other sectors that have been slow to add jobs include Information at 120,000; Retail Trade at 144,000; and Manufacturing at 171,000.
Government—the sector this publication supports—has seen employment expand by 483,000, right in the middle of the broad sectors shown. Employment in the government sector was net negative through the middle of 2023, and turned positive when states began expanding their spending on employment with the massive amount of revenue generated in the past three years.
Figure 6: Change in Employment Since February 2020, Selected Months
The Demographic Picture
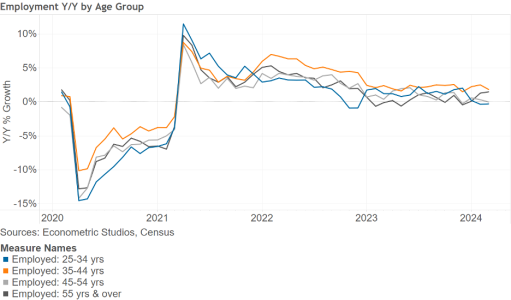
The seventh figure is the year-over-year change in employment by age group. Interestingly, the fastest growing age group as of March 2024 is individuals aged 35 to 44, growing at a 2 percent clip. Catching up with this prime working age group is the older population, up 1 percent year-over-year. In third place, basically flat since last year, are individuals aged 45 to 54. Lastly, the slowest growing group is the youngest age group, 25 to 34 years of age, with employment in this age group down slightly on a year-over-year basis. It is this age group that policymakers may want to be concerned about.
Figure 7: Year-over-Year Growth in Employment by Age Group
Summing Up
Overall, the American employment picture is relatively healthy, with employment at an all-time high even though full-time employment has been trickling down over the past year. To some, the jobs outlook may appear to be nearing peak employment, whereas to others the employment market is hitting a healthy cruising speed. The coming months will give us more tell on what the true story is.
Author: Thomas Young, PH.D. is an economist who splits his time between economic consulting, investing, and appraising. He is a long-time advisor to elected officials, federal and state agencies,and public/private investors. He did his Ph.D. in business economics from the University of Utah.
 (No Ratings Yet)
![]() Loading...
Loading...
Kenneth Meyer
May 1, 2024 at 5:39 pm
Nice summation of important labor statistics. I Would like to this piece if it could be summarized into 800 or words in my Public Personnel Management, 3rd E. If interested, contact me and I will send all the particulars.
C.Kenneth Meyer, Thomas F. Sheehan Distinguished Professor of Public Administration