Widgetized Section
Go to Admin » Appearance » Widgets » and move Gabfire Widget: Social into that MastheadOverlay zone

Teaching through Multimedia: Adding Diagrams to Enhance Public Administration Course Delivery

The views expressed are those of the author and do not necessarily reflect the views of ASPA as an organization.
By Lois Warner
January 26, 2018
Introduction
 Frequently used in textbooks, diagrams also add clarity to the traditional educational lecture format, supporting students’ understanding by illustrating and organizing concepts and theories, and by modeling relationships between them. The increasing availability of educational technology for delivering public administration courses provides valuable resources for classroom and online teaching and affords opportunities for educators to use diagrams as an integral part of their course material. In most cases these technologies are user-friendly and accessible also to students at different levels in higher education, enabling them to visually develop and present their ideas.
In the past, formulating diagrams for higher education was time consuming, requiring a measure of draftsmanship. Modern technology provides software that renders the inclusion of diagrams more appealing for a range of course delivery and participation purposes. These diagrams incorporate scientifically tested color combinations which improve visual impact, advance communications and systematize relationships among concepts and variables. This article serves to highlight the scope for these in public administration education. Like other articles in this quarterly column, the emphasis is on supporting and enhancing learning through the use of multiple complementary and mutually reinforcing media.
Diagrams and Public Administration Course Delivery
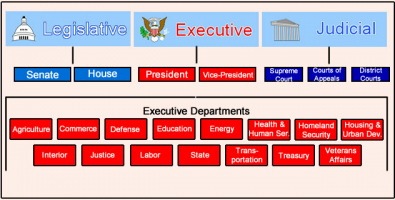
Public administration curricula introduce students to the field, explaining organizational frameworks and management strategies, including the measurement of their efficiency and effectiveness; and reviewing administrative functions, processes and practices through related scholarship and observation. For each of these educational components diagrams provide for greater clarity and understanding. The basic organizational chart included in computer word processing programs, for example, can map the hierarchy of delegated authority in public organizations, their departmentalization and relationships of accountability between them. The flexibility of contemporary versions of diagraming software simplifies the explanation, study and comparison of those organizational aspects.
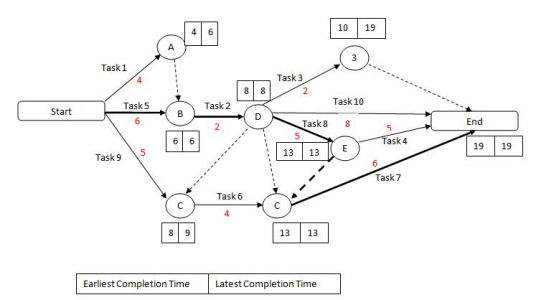
Other basic diagraming software provide for formulating flowcharts and onion diagrams. Flowcharts map processes and procedures, and demonstrate relationships among departments and related entities within a system. The core of the diagram represents central factors. By their positioning, other dimensions of the diagram explain sequence, proximity and comparative impact. In most cases public organizations and their programs involve multiple actors and stakeholders. Flowcharts and onion diagrams can be useful in simplifying the explanation and study of such organizational relationships and their interdependency. These tools can also be used to demonstrate larger environmental contexts that include multiple departments and their agencies, where consideration of external factors is also appropriate.
Indeed, there is a lot of scope for utilizing basic diagraming technology, but software is also available for more advanced construction of diagrams, and for incorporating statistical data and analysis. Computer drawing technology enables the creation of unique diagrams. Most computer packages include basic versions of these with easy-to-follow instructions. The need to use drawing software is diminished by the flexibility of existing templates, readily available in existing diagraming technology. Similarly, data can be incorporated into existing diagram templates, for example, to rank components. Advanced programs for data collection and analysis, however, have built-in capacities for creating more detailed diagrams that reflect more complex relationships and processes: path analysis, for example.
Additional Resources for Creating Diagrams
Competence increases with creating diagrams through the readily accessible computer programs described above. By recognizing the potential for using diagrams to enhance public administration learning processes, it is beneficial to keep abreast of additional resources as they become available for creating and using diagrams for all the purposes discussed here, from enhancing lectures and students’ visual presentations that demonstrate their learning, to diagrams useful for student-to-student discussions and information sharing. Examples of these are included Educational Technology and Mobile Learning (ETML), an online resource of educational applications and tools for educators.
One of the tools recommended through ETML is Lucidchart, a collaborative technology with templates as well as diagram creation tools that facilitate online real-time collaboration. Other tools for creating diagrams and collaboration are Creatly, Infogram and MetaChart, all designed for generating and exchanging visual images that represent concepts and related data.
A useful resource for inspiration in diagraming public administration topics can be found in Public Management and Administration Illustrated, with diagrams on topics such as the public sector environment, managing human resources and managing and improving public performance.
Conclusion
It is foreseeable that the importance of using technologies for generating and exchanging diagrams in public administration educational environments will increasingly have similar applications and significance in the public sector workplace, for documenting and communicating information within and across departments and with the public at large. Hence, the growing need to keep abreast of diagramming software development, and to assist students in building competence and aptitude in meaningfully applying these tools. It should be noted many contemporary tools for creating and sharing educational diagrams have mobile applications for use via Smartphone, and on social media, where public organizations are building greater presence.
Author: Lois Warner is an Assistant Teaching Professor at the School for Public Affairs and Administration, Rutgers, The State University of New Jersey. She is also the Teaching Resources Coordinator, and serves as a Member at Large on ASPA-SPAE’s Executive Board and as ASPA-SHARE’s Chair-Elect.
 (No Ratings Yet)
![]() Loading...
Loading...
Follow Us!